
How Much Do Sports Stadiums Cost? US Stadium Construction Costs and Public Subsidies
This page presents construction costs and public subsidies associated with US professional sports venues. The estimates draw on venue-level cost data covering major-league stadiums and arenas, with all historical costs adjusted for inflation to 2024 dollars. I describe the venue construction costs in more detail in Chapter 5 of This One Will Be Different.
How much does the typical US sports venue cost?
The construction costs of sports venues can be measured in several ways, but the median (middle) value provides a benchmark estimate of typical venues. Among the 132 stadiums and arenas that hosted teams in the five major US-based professional sports leagues in 2025, the median construction cost was $393 million. The median public contribution was $227 million, representing 58% of total construction costs.
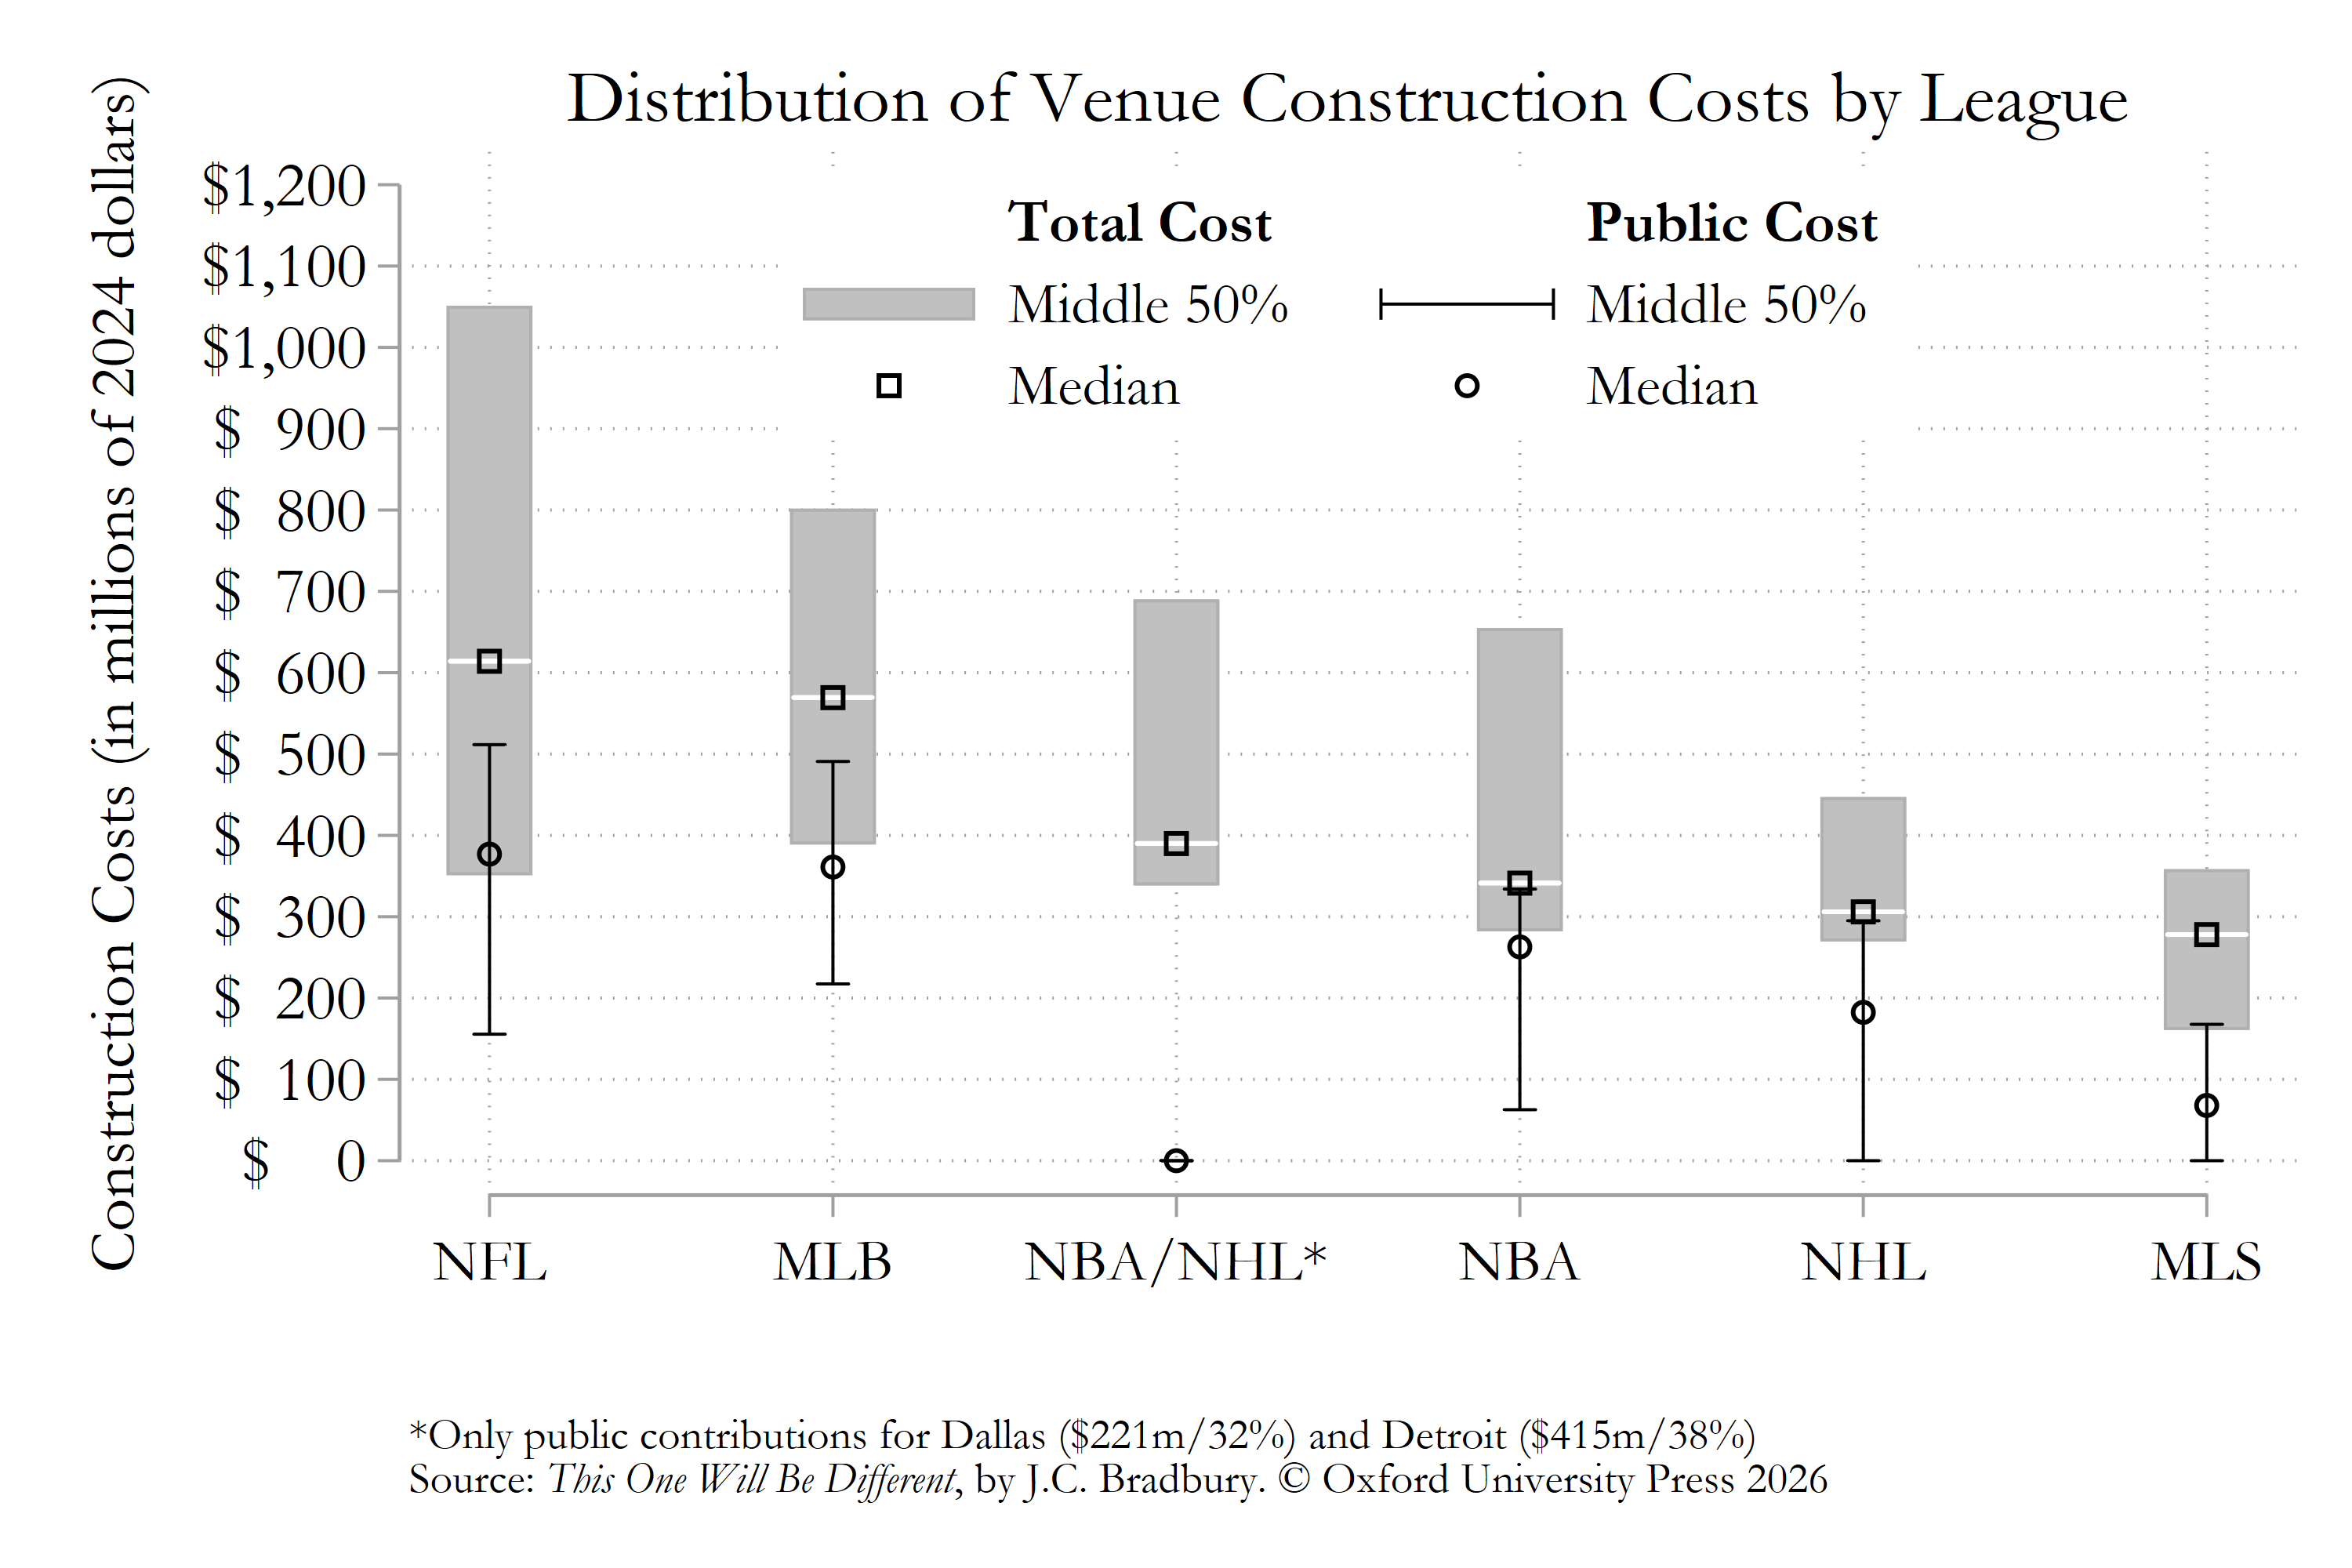
Median total construction costs vary by league, ranging from $614 million for NFL venues to $278 million for MLS venues. Among venues used primarily as single-sport facilities by the traditional Big-4 sports leagues (MLB, NFL, NBA, NHL), median public shares range from 64% to 74%. Nine of 11 shared NBA/NHL arenas were privately financed, possibly because sharing a facility improves cost-effectiveness. The median public share for MLS venues is 41%.
| League | Venues | Median Total Cost | Median Public Cost | Median Public Share |
|---|---|---|---|---|
| NFL | 30 | $614 | $377 | 68% |
| MLB* | 29 | $569 | $361 | 70% |
| NBA/NHL | 11 | $390 | $0 | 0% |
| NBA | 19 | $341 | $263 | 74% |
| NHL† | 20 | $306 | $182 | 64% |
| MLS‡ | 23 | $278 | $68 | 41% |
| All Venues | 132 | $393 | $227 | 58% |
Notes: Costs are in millions of 2024 dollars. * Excludes the Athletics' temporary facility in Sacramento. † Excludes the Seattle Kraken's heavily renovated arena. ‡ Excludes facilities shared with MLB or NFL teams and Inter Miami's temporary facility.
The figure below compares the distributions of total and public venue construction costs by league. The boxes show the middle 50% of observations, while the line within each box marks the median.
How much have taxpayers spent on sports stadiums?
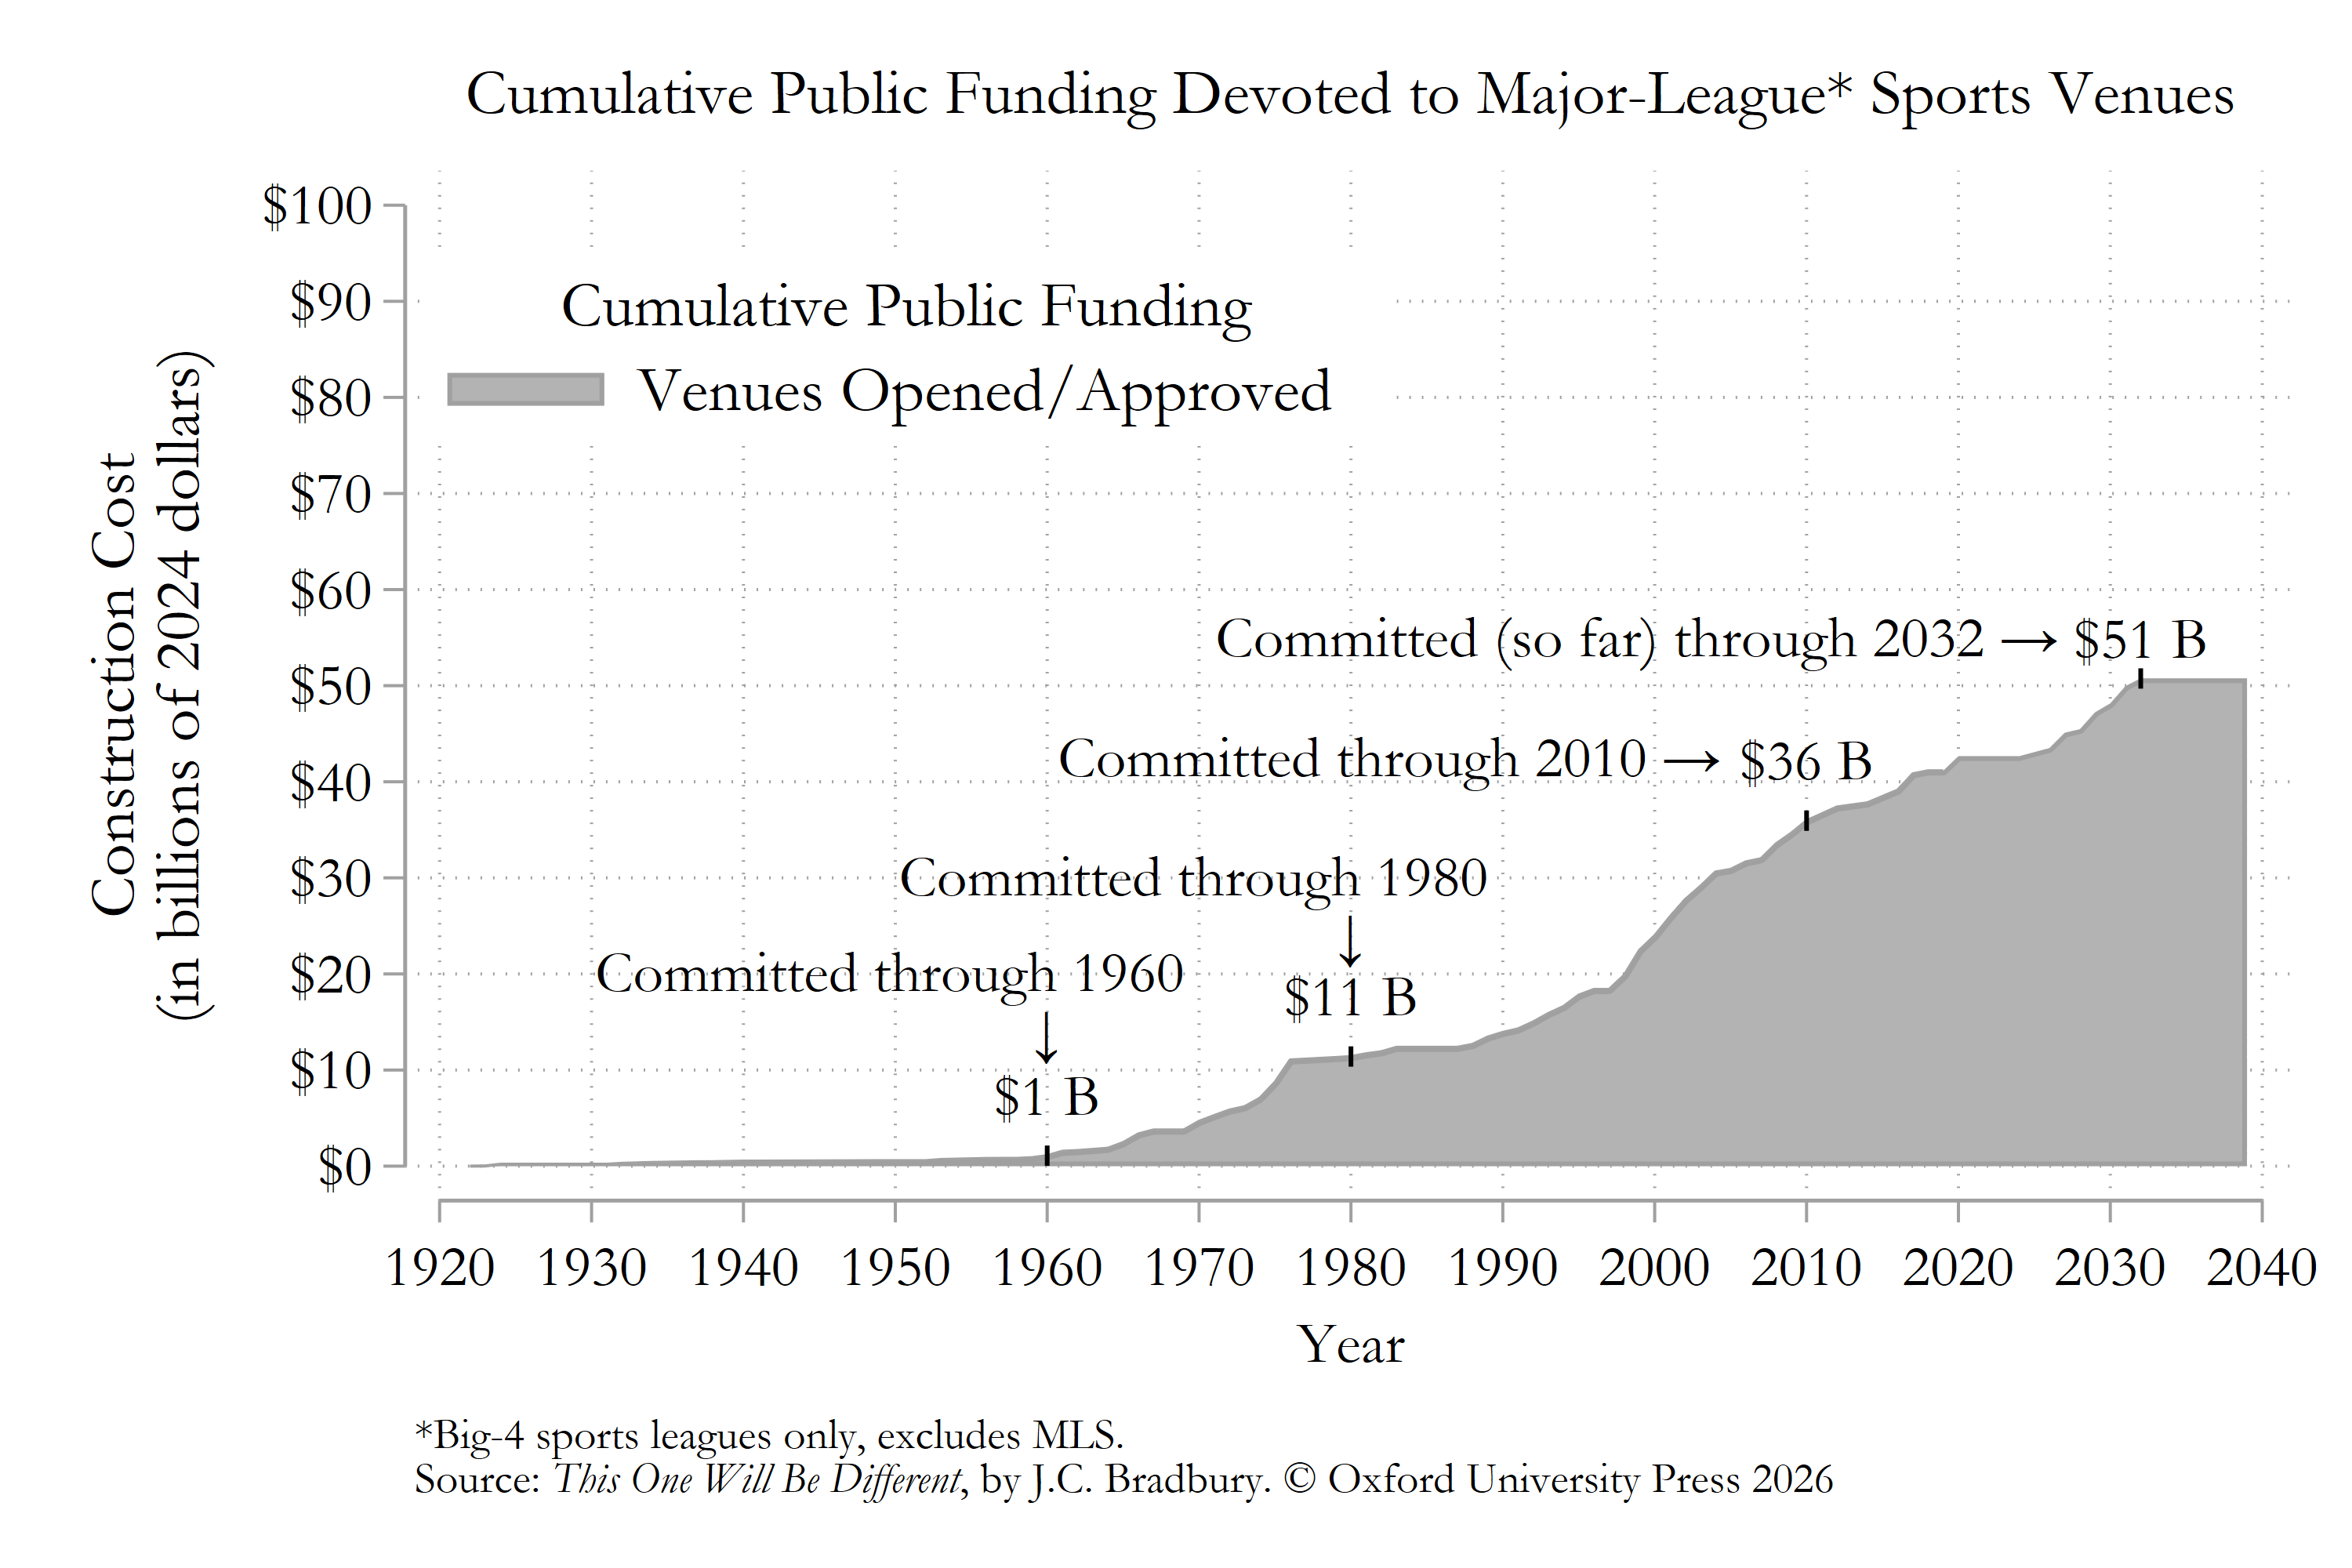
Since governments began contributing public funds to professional sports venues in the 1920s, taxpayers have committed a total of $51 billion to new stadiums and arena construction.
How have stadium construction costs changed over time?
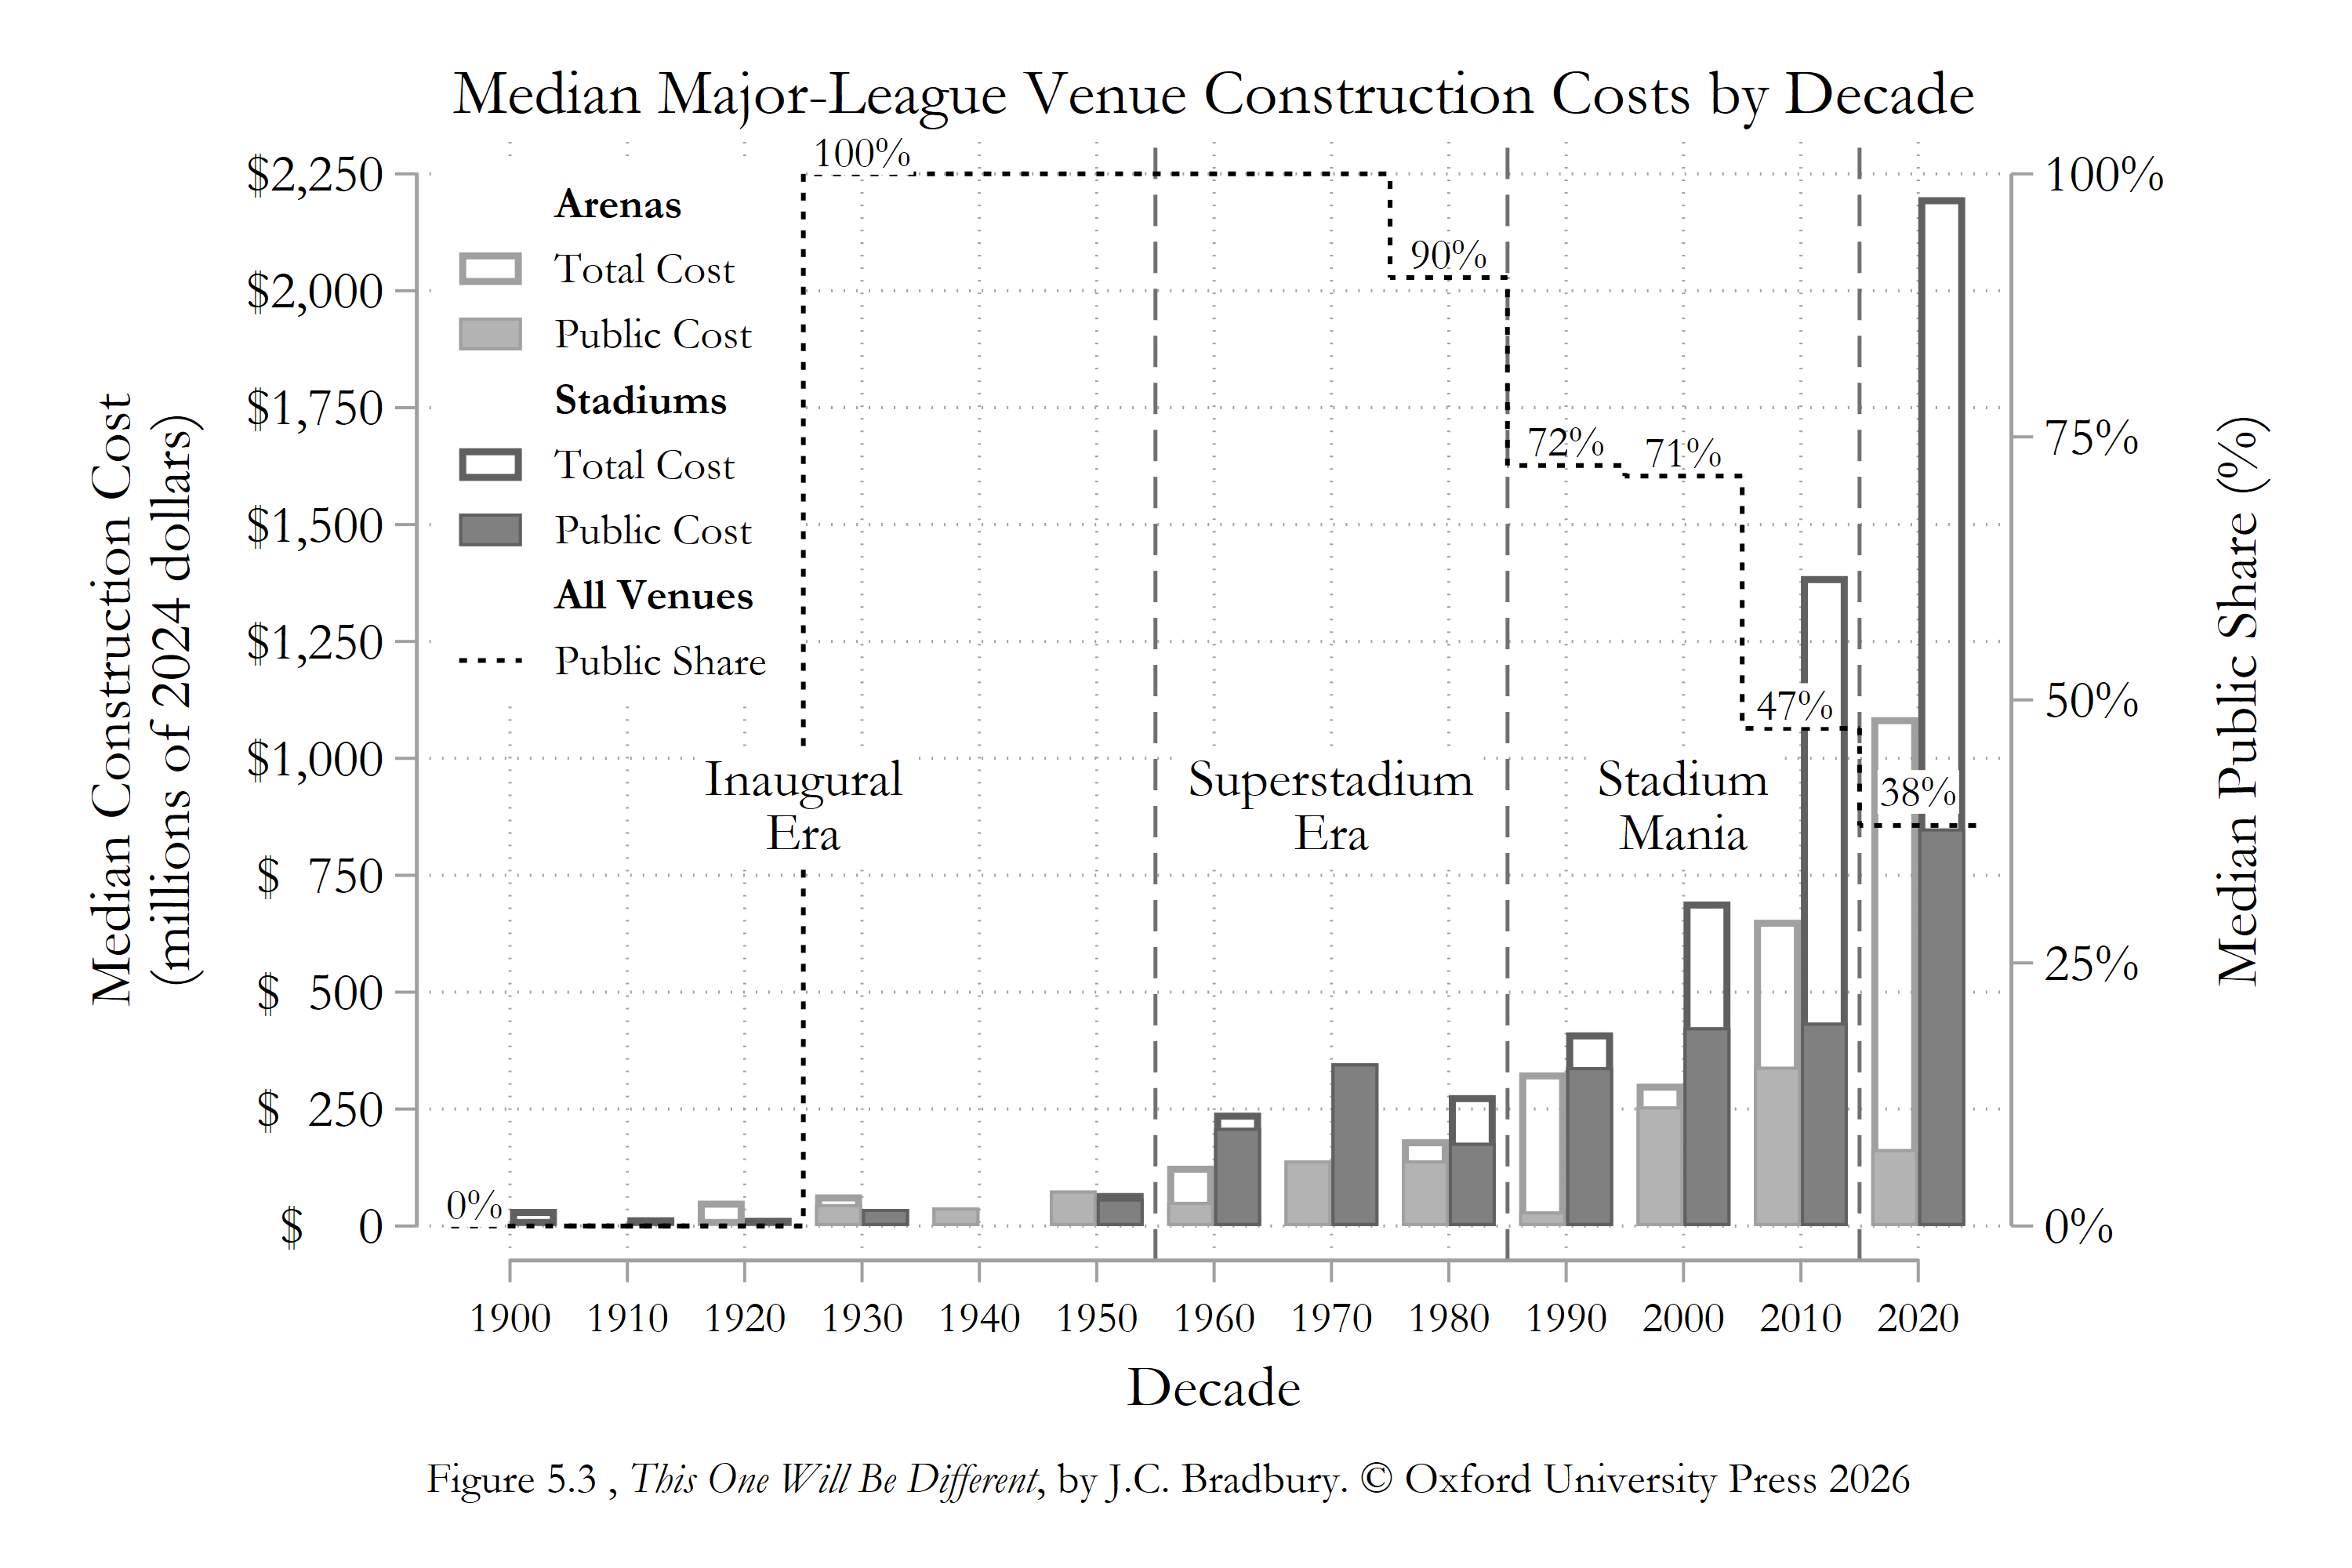
Professional sports venues were entirely private ventures in the early 1900s, when MLB teams constructed their first modern concrete and steel stadiums. These ballparks were improvements over the impermanent wooden structures they replaced, which were prone to fire, but they remained simple facilities that served the basic function of seating spectators. The durable nature of reinforced concrete allowed them to last 60 years or longer—inaugural-era ballparks Fenway Park (Boston) and Wrigley Field (Chicago) continue to host major-league teams. Typical total construction costs for venues that opened during the first half of the 20th century ranged from $15 million to $70 million. Financing switched from being fully private to almost entirely public in the 1930s.
In the 1960s, teams began replacing inaugural-era venues with municipally owned multi-sport stadiums that could host baseball and football (as well as arenas that could host basketball and hockey). These superstadiums were not only larger than their predecessors, but they included improved designs with more restrooms, concessions, and parking. Their revenue model emphasized attracting more fans through the turnstiles. Superstadium-era venues that opened from the 1960s through the 1980s typically cost between $100 million and $300 million, substantially more than the facilities they replaced, with taxpayers covering the vast majority of the cost.
The lifespans of mid-century venues were closer to 30 years. In the 1990s, teams began building sport-specific facilities, with retro/classic designs that mimicked inaugural-era architecture. Replacing multi-sport venues two at a time resulted in the “stadium mania” construction wave that peaked around 2000. Facilities became smaller and generated greater revenue from luxury amenities like private suites, club seats, and non-sports entertainment. Construction costs jumped again, with median costs increasing from $358 million in the 1990s to $580 million in the 2000s and $864 million in the 2010s. Though the public share declined, median public contributions grew from $205 million in the 1990s to $605 million in the 2010s.
The discussion above describes the general progression of venue construction costs, while the following figure provides a more detailed graphical summary by decade and venue type.
Which US sports venues cost the most?
The tables below rank the costs of stadiums and less expensive arenas. The lists include both completed and approved future venues. See the Historical Database of US Major-League Venues in Appendix A of This One Will Be Different for a complete list of construction costs for all US major-league sports venues.
Top 10 Most Expensive Stadiums (MLB and NFL)
| Rank | Venue | Year Opened | Teams | Total Cost | Public Cost |
|---|---|---|---|---|---|
| 1 | SoFi Stadium | 2020 | Los Angeles Chargers & Rams | $6,655 | $0 |
| 2 | New Chiefs Stadium | 2031 | Kansas City Chiefs | $3,000 | $1,800 |
| 3 | Olympic Stadium | 1976 | Montreal Expos | $2,970 | $1,488 |
| 4 | New Commanders Stadium | 2030 | Washington Commanders | $2,700 | $930 |
| 5 | New Browns Stadium | 2029 | Cleveland Browns | $2,400 | $900 |
| 6 | Allegiant Stadium | 2020 | Las Vegas Raiders | $2,384 | $908 |
| 7 | MetLife Stadium | 2010 | New York Giants & Jets | $2,261 | $0 |
| 8 | New Highmark Stadium | 2026 | Buffalo Bills | $2,200 | $850 |
| 9 | New Nissan Stadium | 2027 | Tennessee Titans | $2,200 | $1,260 |
| 10 | Mercedes-Benz Stadium | 2017 | Atlanta Falcons | $2,048 | $896 |
Notes: Costs for open venues are in millions of 2024 dollars. Future venue costs are announced values.
Top 10 Most Expensive Arenas (NBA and NHL)
| Rank | Venue | Year Opened | Teams | Total Cost | Public Cost |
|---|---|---|---|---|---|
| 1 | Intuit Dome | 2024 | Los Angeles Clippers | $1,800 | $0 |
| 2 | Chase Center | 2019 | Golden State Warriors | $1,722 | $0 |
| 3 | Barclays Center | 2012 | Brooklyn Nets & New York Islanders | $1,370 | $722 |
| 4 | New Spurs Arena | 2032 | San Antonio Spurs | $1,300 | $800 |
| 5 | UBS Arena | 2021 | New York Islanders | $1,276 | $0 |
| 6 | Madison Square Garden | 1968 | New York Knicks & Rangers | $1,198 | $0 |
| 7 | Little Caesars Arena | 2017 | Detroit Pistons & Red Wings | $1,105 | $415 |
| 8 | New Thunder Arena | 2029 | Oklahoma City Thunder | $900 | $850 |
| 9 | Golden 1 Center | 2016 | Sacramento Kings | $701 | $334 |
| 10 | American Airlines Center | 2001 | Dallas Mavericks & Stars | $690 | $221 |
Notes: Costs for open venues are in millions of 2024 dollars. Future venue costs are announced values.
Which sports venues received the largest public subsidies?
Top 10 Largest Stadium Subsidies (MLB and NFL)
| Rank | Venue | Year Opened | Teams | Total Cost | Public Cost | Public Share |
|---|---|---|---|---|---|---|
| 1 | New Chiefs Stadium | 2031 | Kansas City Chiefs | $3,000 | $1,800 | 60% |
| 2 | Olympic Stadium | 1976 | Montreal Expos | $2,970 | $1,488 | 50% |
| 3 | New Nissan Stadium | 2027 | Tennessee Titans | $2,200 | $1,260 | 57% |
| 4 | Caesars Superdome | 1975 | New Orleans Saints | $950 | $950 | 100% |
| 5 | New Commanders Stadium | 2030 | Washington Commanders | $2,700 | $930 | 34% |
| 6 | Allegiant Stadium | 2020 | Las Vegas Raiders | $2,384 | $908 | 38% |
| 7 | Lucas Oil Stadium | 2008 | Indianapolis Colts | $1,051 | $905 | 86% |
| 8 | New Browns Stadium | 2029 | Cleveland Browns | $2,400 | $900 | 38% |
| 9 | Mercedes-Benz Stadium | 2017 | Atlanta Falcons | $2,048 | $896 | 44% |
| 10 | New Highmark Stadium | 2026 | Buffalo Bills | $2,200 | $850 | 39% |
Notes: Costs for open venues are in millions of 2024 dollars. Future venue costs are announced values.
Top 10 Largest Arena Subsidies (NBA and NHL)
| Rank | Venue | Year Opened | Teams | Total Cost | Public Cost | Public Share |
|---|---|---|---|---|---|---|
| 1 | New Thunder Arena | 2029 | Oklahoma City Thunder | $900 | $850 | 94% |
| 2 | New Spurs Arena | 2032 | San Antonio Spurs | $1,300 | $800 | 62% |
| 3 | Barclays Center | 2012 | Brooklyn Nets & New York Islanders | $1,370 | $722 | 53% |
| 4 | Kia Center | 2010 | Orlando Magic | $547 | $475 | 87% |
| 5 | PPG Paints Arena | 2010 | Pittsburgh Penguins | $462 | $442 | 96% |
| 6 | Little Caesars Arena | 2017 | Detroit Pistons & Red Wings | $1,105 | $415 | 38% |
| 7 | FedEx Forum | 2004 | Memphis Grizzlies | $415 | $344 | 83% |
| 8 | Northlands Coliseum | 1974 | Edmonton Oilers | $343 | $343 | 100% |
| 9 | Rogers Place | 2016 | Edmonton Oilers | $469 | $341 | 73% |
| 10 | Gainbridge Fieldhouse | 1999 | Indiana Pacers | $335 | $335 | 100% |
Notes: Costs for open venues are in millions of 2024 dollars. Future venue costs are announced values.
How are stadium costs measured?
The estimates reflect publicly reported capital costs for buildings, land, and infrastructure associated with constructing venues that serve as the primary long-term home of a major-league team. The costs do not include maintenance and operating expenditures and may not capture additional in-kind contributions of public land or supporting infrastructure, which are often not reported.
Data on stadium construction and funding were compiled from several sources. Judith Grant Long’s Public-Private Partnerships for Major League Sports Facilities (Table 2.1) is the source for much of the cost data through 2010. Its consistent valuation framework and expert review make it a particularly useful source for historical comparisons. I collected post-2010 and a few other missing observations from various media sources. Publicly reported costs often differ across sources, and reporting standards are not identical over time or across publications; therefore, the cost estimates are based on accounts that I determined to be the most credible. These data represent ballpark figures—literally and figuratively—but they are sufficiently reliable to reflect general trends in venue construction, financing, and costs.
Appendix A in This One Will Be Different provides a full description of included costs, collection methods, and sources.
What costs are commonly omitted from stadium subsidy estimates?
The estimates do not include all direct and in-kind government subsidies that sports venues receive. Because these costs are not consistently reported, they cannot be reliably tracked over time. Supplementary contributions include area infrastructure improvements, capital maintenance and upgrades, ongoing operations, and tax abatements and exemptions. Thus, a venue listed as receiving zero subsidies may have benefited from some public contributions. Urban planning scholar Judith Grant Long (see here and here) has estimated that these added expenses can increase the taxpayer burden beyond officially budgeted costs by 25% to 40%
Public policy researcher Geoffrey Propheter estimated that the tax benefits from government ownership of stadiums translated to an additional $22 billion in foregone local government revenue over the remaining lives of venues active in 2021—approximately $7.5 million per year, with 40% of the diverted funds coming from K–12 education.
Stadiums financed through municipal bonds are sometimes eligible for a federal tax exemption, which economists Austin Drukker, Ted Gayer, and Alexander Gold estimate to have cost $5.4 billion in lost tax revenue between 2000 and 2020.
(Note: Dollar values in this section converted from reported-year dollars to 2024 dollars.)
How costly are venue renovations?
It is common for venues to undergo extensive renovations to extend their hosting lives, and upgrades of public facilities are frequently accompanied by lease extensions of approximately 15 years. Capital improvements often include reconfiguring large sections of seats, remodeling entertainment spaces like luxury suites and private clubs, redesigning or replacing the building facade, and upgrading concession spaces.
From 1995 through 2024, 41 major-league venues (18 arenas and 23 stadiums) received major renovations, ranging from $58 million to $1.35 billion, with the median cost of $185 million. Twenty-three venues (12 arenas and 11 stadiums) have planned future renovations from 2025 and beyond. Projected renovation costs span from $150 million to $1.4 billion, with an average public cost of $330 million and a middle-50% range of $134 million to $725 million (note: future renovations are stated in announced dollar values).
Overall, venue renovations are cheaper than replacement, but they can still be costly. In some cases, renovation subsidies approach average public contributions for new facilities (for example, Jacksonville Jaguars’ $725 million subsidy to renovate EverBank Stadium).
How much do minor-league baseball stadiums cost?
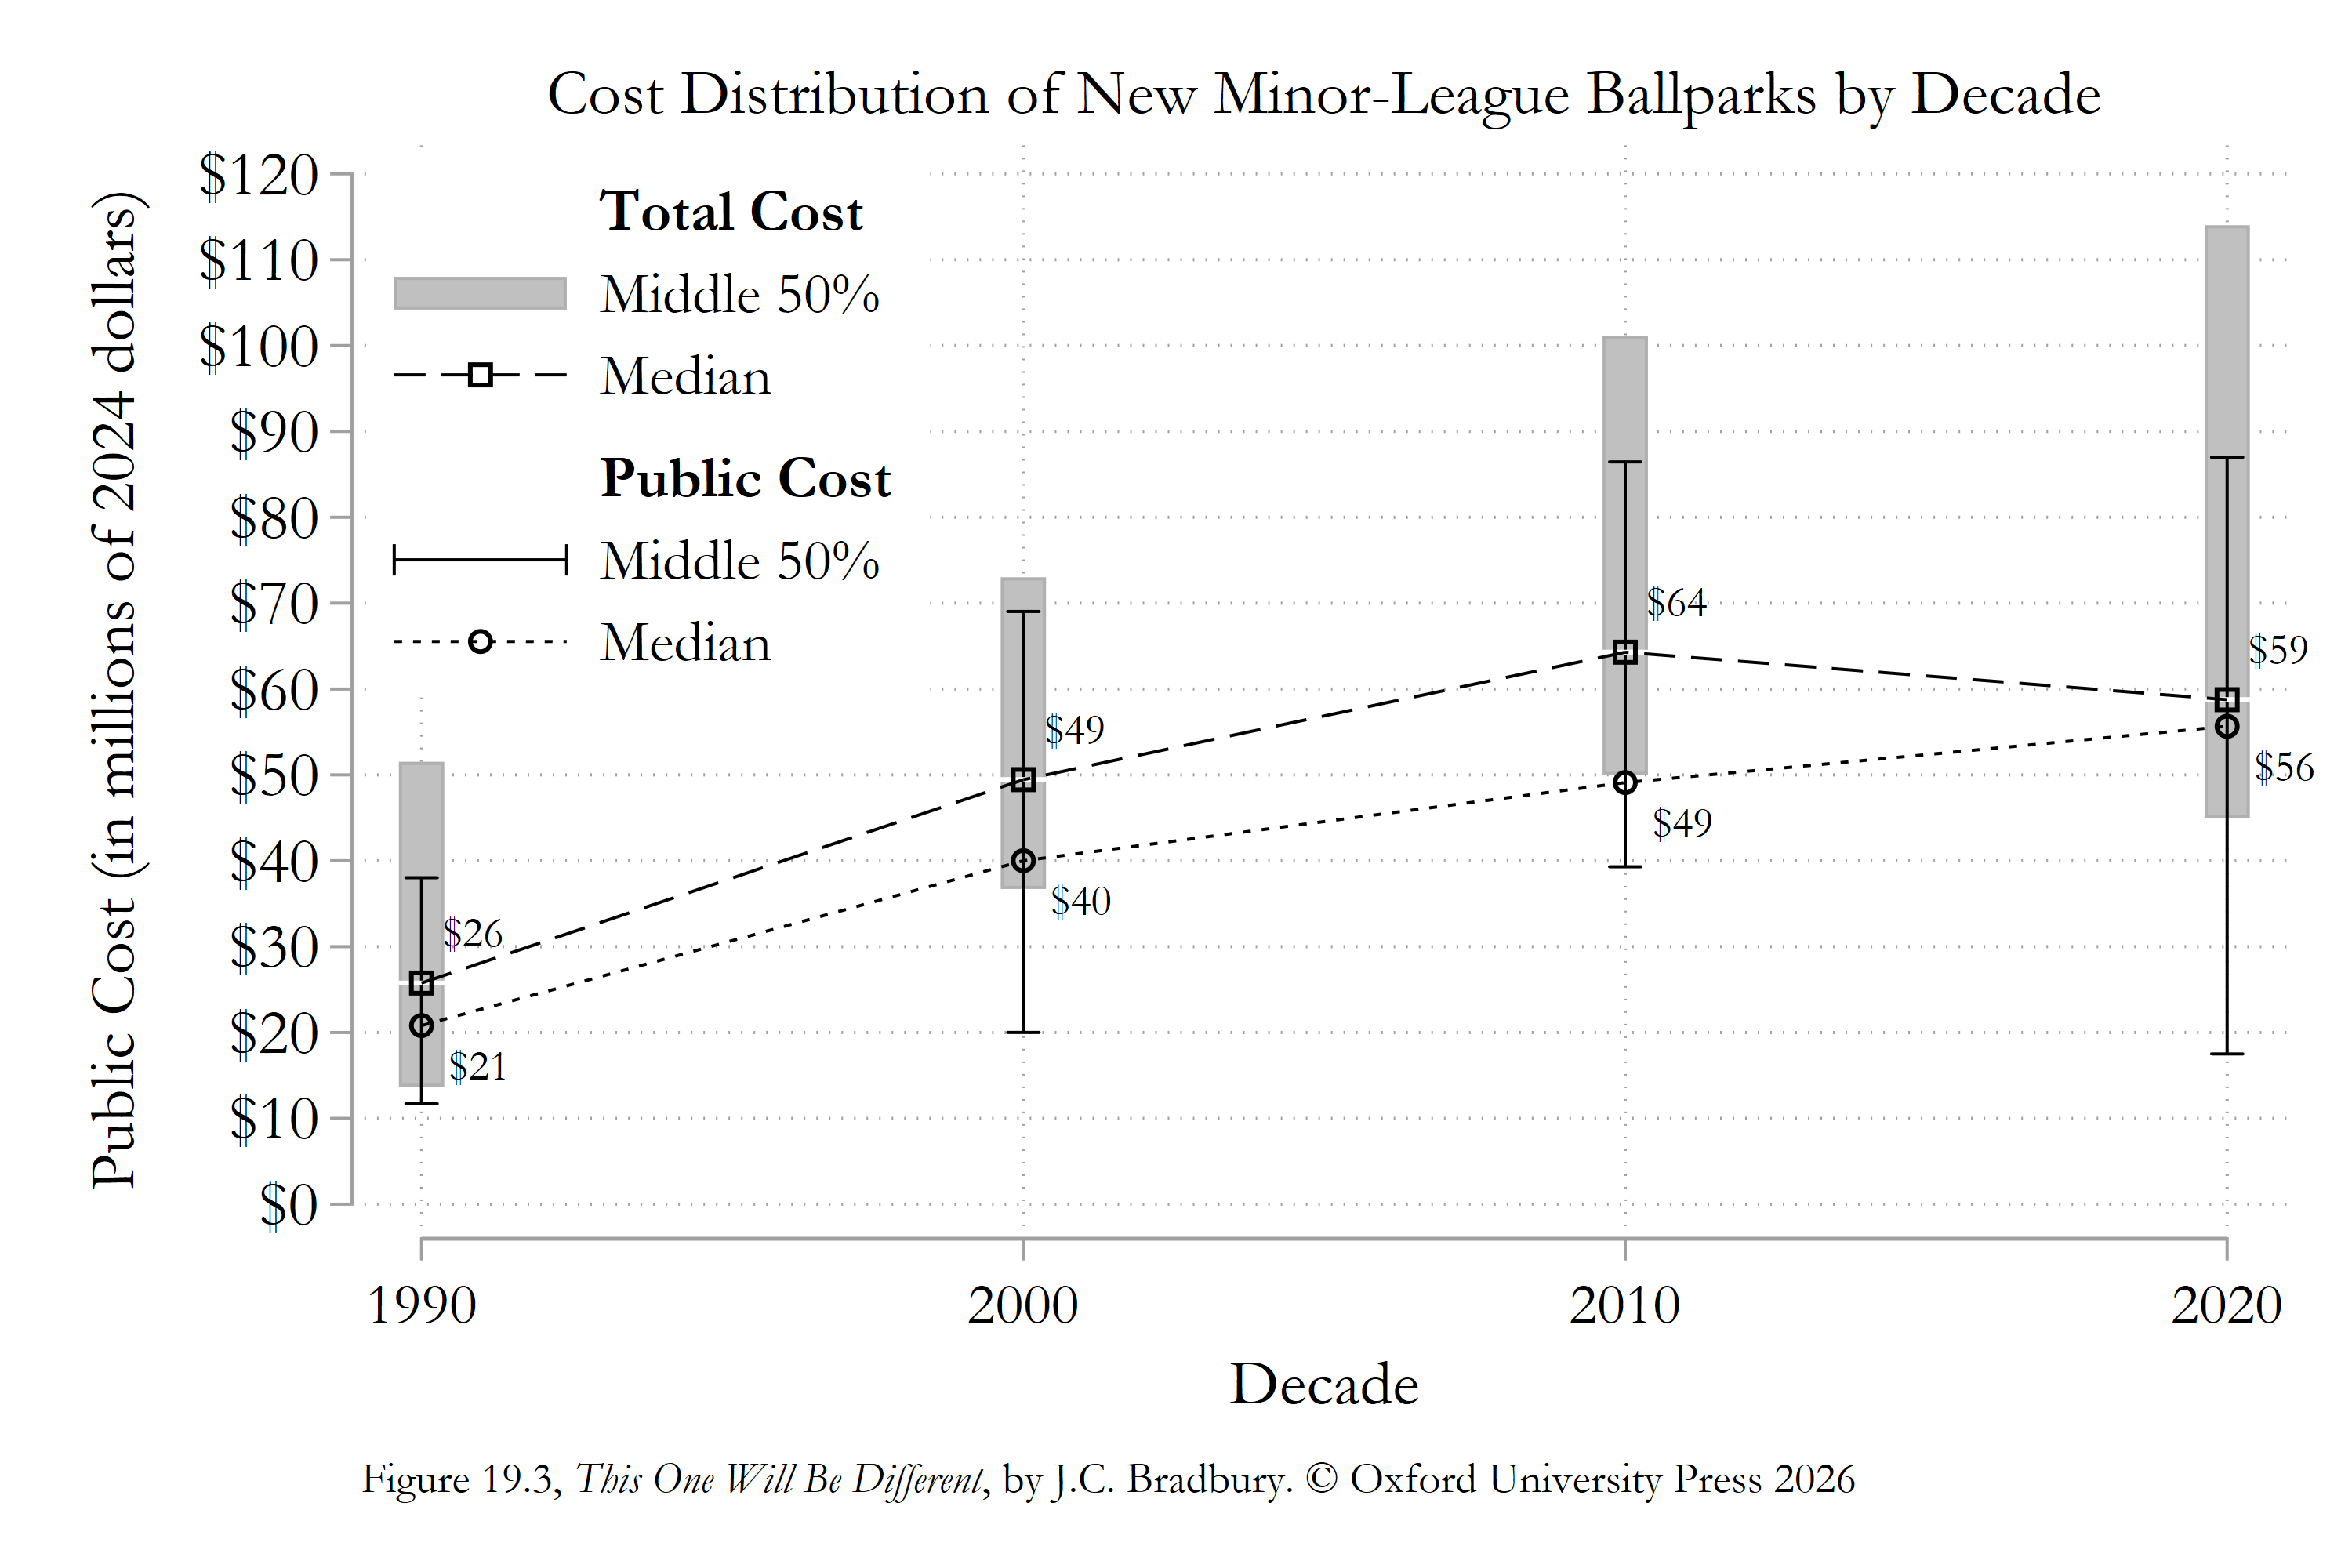
Minor-league ballparks are cheaper than their major-league counterparts, but their construction costs have also risen. Among facilities hosting MLB-affiliated minor-league teams in 2025, the median construction cost for ballparks built in the 2020s was $59 million. That is nearly three times the median cost of ballparks built in the 1990s, when minor-league baseball experienced its own stadium-construction boom. These facilities also receive substantial public support, with a median public share of 78%.
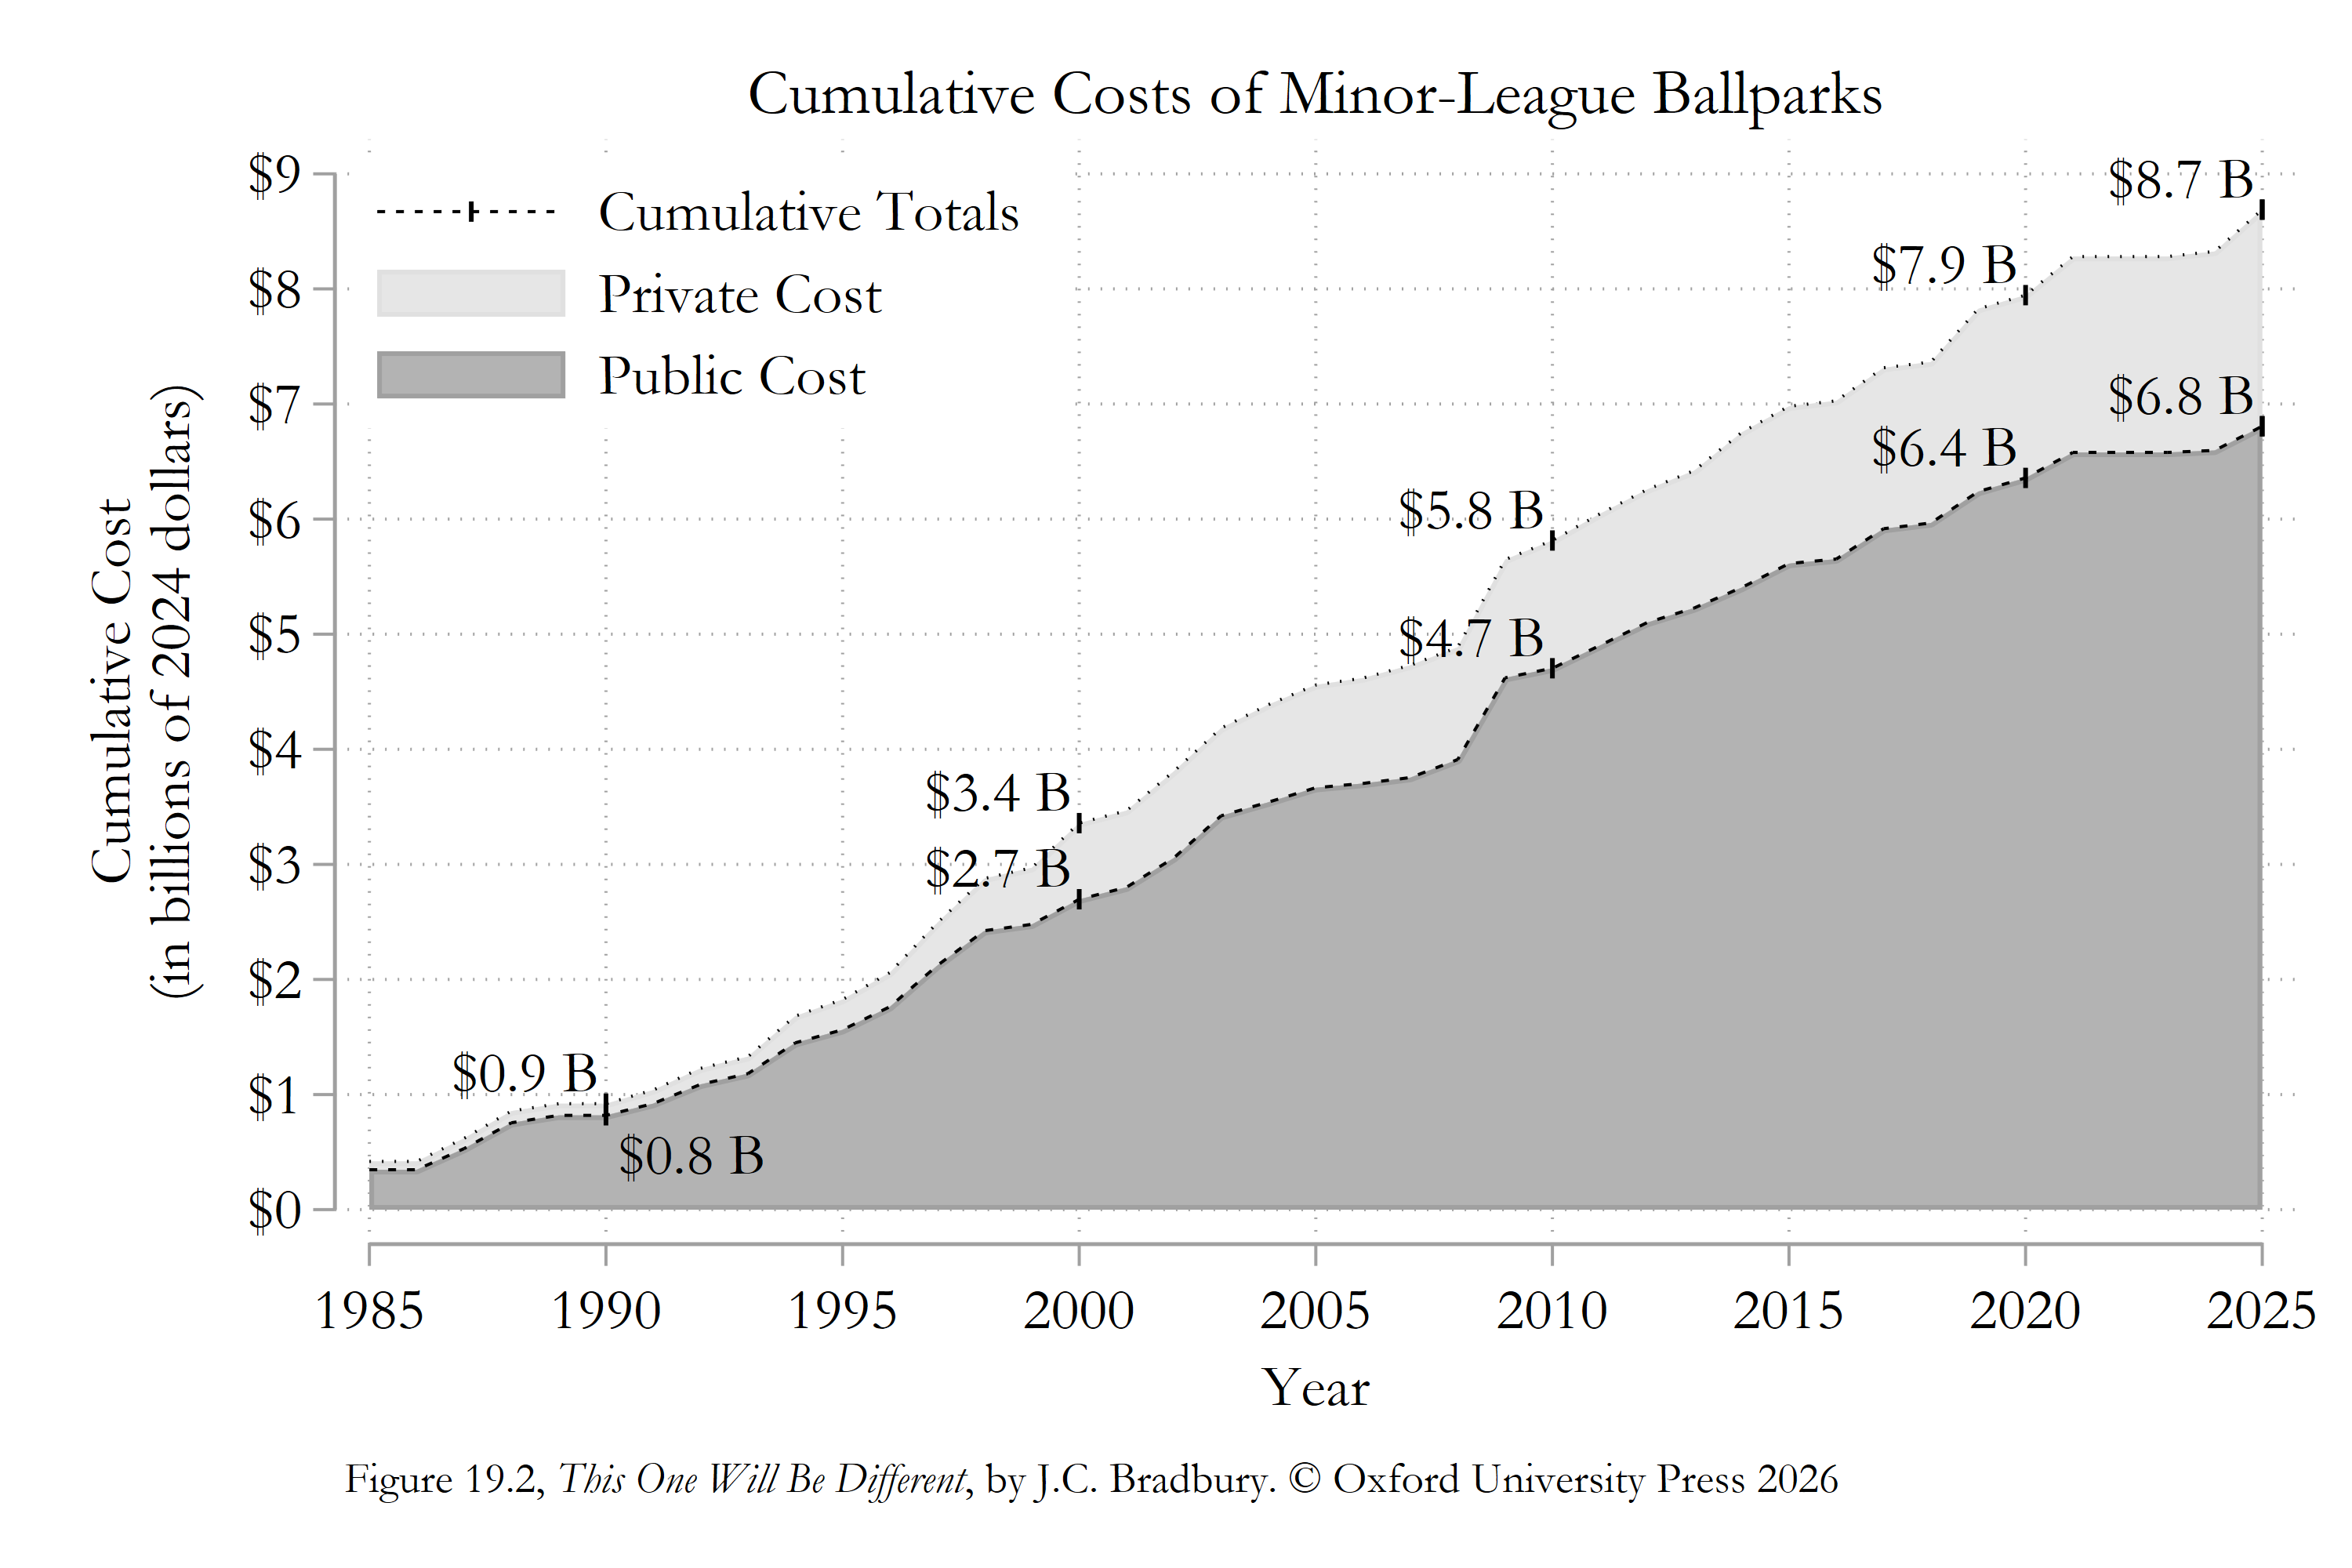
Minor-league stadiums also regularly receive renovations, which are often heavily subsidized. The cumulative construction and renovation costs of the 132 minor-league facilities amount to $8.7 billion, and $6.8 billion was covered by taxpayers.
For more details on minor-league baseball stadium financing, see my study
For more details on minor-league baseball stadium financing, see my study The Public Cost of Minor League Baseball Stadium Subsidies and Chapter 19 of This One Will Be Different.
First published: August 5, 2026
Last updated: August 9, 2026
About the author
J.C. Bradbury is a professor of economics at Kennesaw State University. His research focuses on sports economics, public finance, and local economic-development policy. He is the author of This One Will Be Different: False Promises and Fiscal Realities of Publicly Funded Stadiums, published by Oxford University Press.
Related resources
- Do Sports Stadiums Help Local Economies? — A primer on the economic effects of stadiums.
- How Are Stadiums Paid For? — A primer on public financing of stadiums.
- Stadium Economics — Articles, research, videos, and public presentations.
- This One Will Be Different — A comprehensive examination of publicly funded sports stadiums.